A cash flow budget is a forecast to help determine what your cash balance will be in the future.
Monitoring your cash balance is a vital importance in both business and personal life. This is why in business financial reports one of the three main reports provided to stakeholders is a Cash Flow Statement detailing how cash has been collected and paid over the financial reporting period.
In this article we will create our cash flow budget, and this will help to show how businesses construct their cash flow reports, which can help you in your own financial journey.
How Do You Create A Cash Flow Budget?
In its most basic form a cash flow budget comprises of three sections:
- Cash Inflows
- Cash Outflows
- Cash Balances
The Cash Inflows section is, as the name describes, an area where all forms of cash being received are inserted. From a personal perspective, these would include salaries, wages, bank interest received, dividends received, gifts received, bonuses (etc).
The Cash Outflows section is an area where all forms of cash being spent are placed. From a personal perspective, these would include groceries, maintenance (home & car), rent, mortgage payments, transport costs (gas, fuel, tolls), utilities (etc).
Finally, in the third area which I’ve labelled Cash Balances we have the result of the other two sections. You add up all the Cash Inflow amounts, you then add up all the Cash Outflow amounts, you subtract the Cash Inflow Total from the Cash Outflow Total and this will give you a Net Cash Flow amount. With this amount you get your Opening Cash Balance at the beginning of the budget period and add the Net Cash Flow amount to obtain your Closing Cash Balance .
Here’s an example to help illustrate this final section:
Cash Inflows Total = $5,200
Cash Outflows Total = $4,600
Net Cash Flow = $5,200 - $4,600 = $600
Opening Cash Balance = $11,789
Closing Cash Balance = $11,789 + $600 = $12,389
With this information, I can tell how much I will have in surplus at the end of the period, and what this will look like for my cash bank balance.
Create A Cash Flow Spreadsheet
As you can see there isn’t much to a cash flow report! Therefore, creating a spreadsheet to represent each section isn’t too difficult either.
Here’s how I went about creating my first cash flow spreadsheet.
Step 1 – Cash Inflow & Outflow Sheets
The best way I got started was by creating 2 distinct sheets – one labelled Inflows and another labelled Outflows . The reason why I made these sections as two distinct sheets was to help me to list the different inflows and outflows, and by keeping each as a separate sheet it allowed me to list as many items as I want without disrupting the other sections.
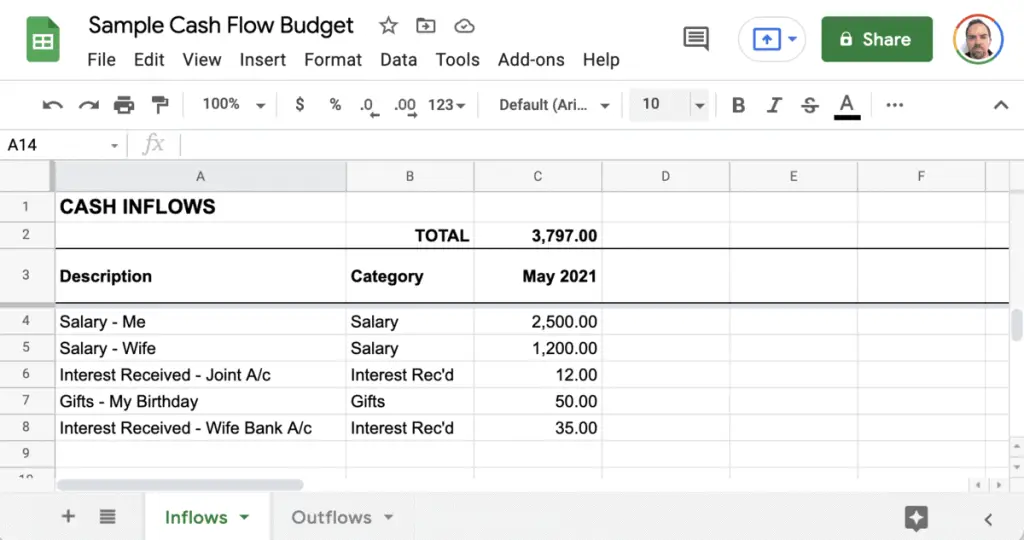
Just be sure to keep a couple of rows blank at the top, before writing your heading row, so that you can list the totals up top. I’m a little weird with the representation of my data as the totals are placed above the data, rather than at the bottom, here’s how my Inflows sheet looks:

- Description of the inflow/outflow (optional, but highly recommended as you may not remember what the transaction was in the future when you come to review);
- How you would like to categorise the inflow/outflow (optional, helpful if you have many different transactions and want to know how much you spend on a particular category, such as tuition fees, school fees, books, etc.);
- How much the inflow/outflow is;
- How often the inflow/outflow occurs (include one-off type transactions);
- Type of cash flow (in/out).
When you’ve gathered this detail the Cash Flow Forecast spreadsheet requires you to insert the data into the two main areas corresponding to the type of cash flow each transaction corresponds to.
Therefore, all the cash inflows will appear in the cash inflow section. Underneath all the cash outflows will appear in the cash outflow section.
Once you’ve finished entering your data into the respective sections the total for each group will be seen at the top of that section. With the resulting net cash flow seen towards the top under the closing balances.
The formula I have in cell C2 as shown in the picture above is:
=SUM(C4:C)Which means we want to sum (add) all the values in the cells from C4 to the very bottom of the sheet, however long that sheet gets. This also means that if we want to add more rows in the future we can by just writing them underneath where our current data exists.
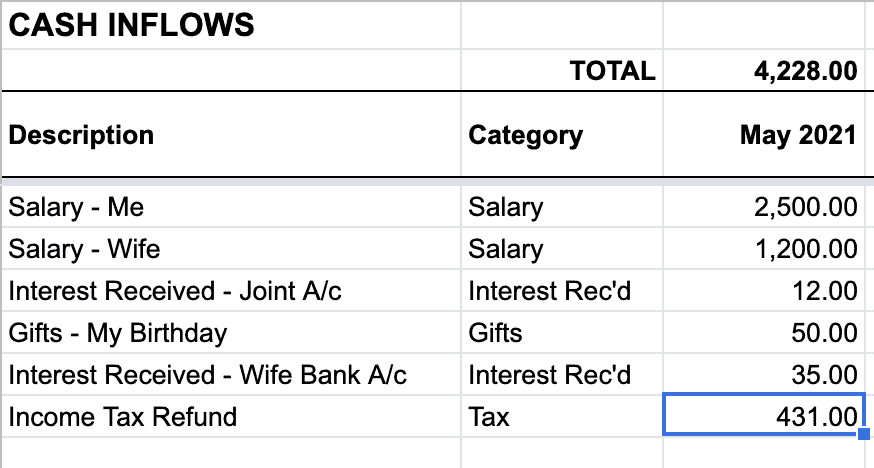
For example, if I wanted to add Income Tax Refund I would write this in row 9 and insert the category and total as normal, and the total cell above automatically changes based on the new data input, as shown here:

If you’ve been able to make it this far, then we’ll done! You’ve successfully created a cash budget !
Make sure you’ve done the same process with your cash outflows, by listing them in the Cash Outflows sheet. And just as we did with the Cash Inflows sheet we want to make sure we have a total row and to have the same formula as what we did with the Cash Inflows sheet.
Once you’ve done that, we can move on to our final step!
Step 2: Net Cash Flow Summary
Now that you have two sheets: one for listing all your Cash Inflows, and another listing all your Cash Outflows, you can summarise this data by creating a new sheet which we’ll label Summary .
The purpose of this sheet is to be a quick way of being able to see how everything is going according to category and what the resulting effect will be on our cash balance at the end of the budget period.
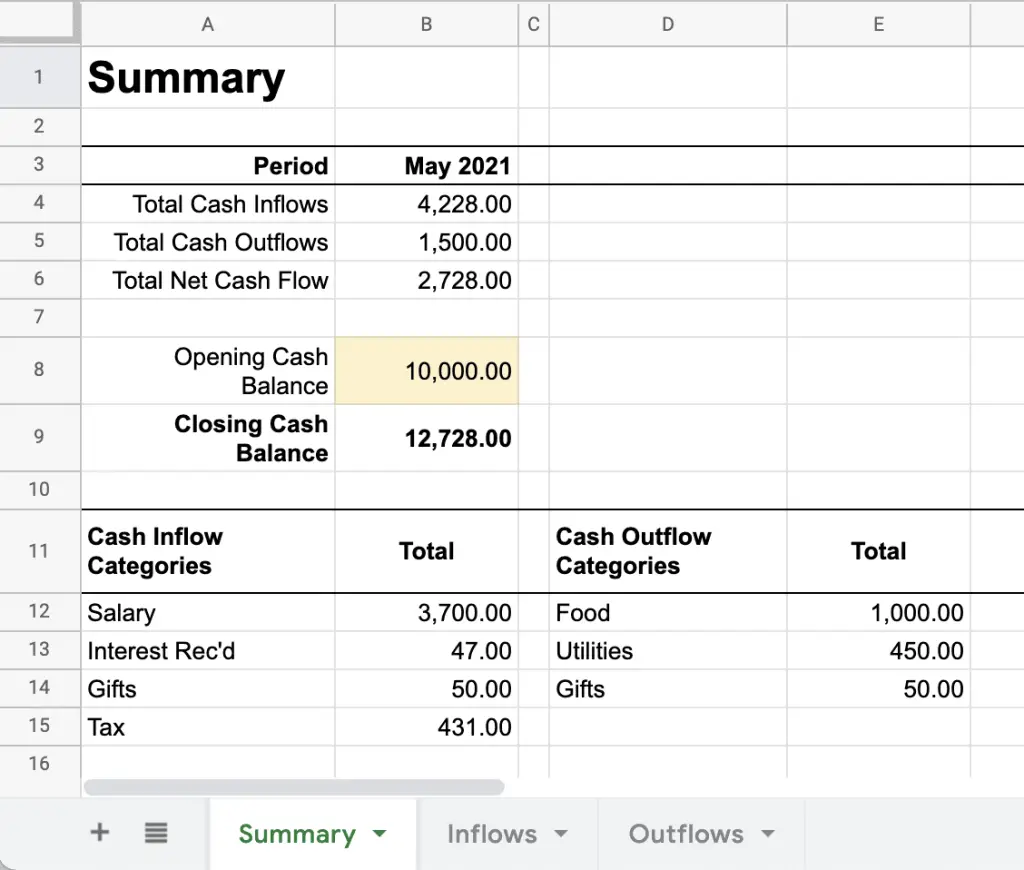
Here’s how I’ve made my resulting Summary page look, and I’ll explain the purpose behind each of the sections below:

The summary sheet is divided into 3 areas:
- Totals & Net Cash Flow area
- Bank Balances
- Category Listing & Totals
You may not want all these three sections in your Summary page, you might just be content with the totals and the resulting bank balance. I have the total categories listed as these are the numbers that I will then go and enter into my bank’s budgeting platform to help me monitor my progress for what I had budgeted.
Calculating Net Cash Flow
To calculate the net cash flow from our Cash Inflows and Cash Outflows sheets I’ve created a formula referencing the totals we already have at the top of each sheet, and with each of these totals in I can create a simple formula for calculating the Net Cash Flow, being:
Net Cash Flow = Total Cash Inflow - Total Cash OutflowOr translated in our Google Sheet, this would be the Total Cash Inflow amount in cell B4 subtracted to the Total Cash Outflow amount in cell B5 , as follows:
=B4-B5Calculating Closing Bank Balance
To calculate what our anticipated closing bank balance will be after calculating our net cash flow, we need one input: the opening bank balance at the start of the budget period. In the working example, as our budget was for the month of May 2021, our opening bank balance would be what it was at the start of the day on the 1st May 2021.
I’ve highlighted this cell a different colour to emphasise the fact that it is an input, to contrast it from the other cells which all contain formulas .
Therefore, once we have the opening bank balance cell defined in our Summary sheet, we can perform our closing bank balance calculation as follows:
Closing Bank Balance = Opening Bank Balance + Net Cash FlowOr translated into spreadsheet formulas to get our budget working, would be (in cell B9 ):
=B8+B6Calculating Category Totals
This last section in our Summary page is optional, but highly recommended as it will enable you to track your budget with your banking app to see how your spending is going against what you’ve anticipated.
This section does involve a little more knowledge of Google Sheet’s spreadsheet functions, but they aren’t too difficult to understand.
The first thing we need to do is to get a listing of all the
unique
categories listed on our
Cash Inflows
sheet. To do this we will use the aptly named function
unique()
and insert the range for what we would like Google Sheets to obtain. In our example this would be:
=UNIQUE(Inflows!B4:B)This achieves our desired result, and we would insert this formula in cell A12 after creating our headings Cash Inflow Categories (cell A11) and Total (cell B11).
Starting in row
B12
we now want to obtain the total of our cash inflows for each unique category listed. Once again, the wonderful Google Sheets spreadsheet has a handy function
=SUMIFS()
that we can use to capture this data. The
SUMIFS()
function requires at least three parameters:
- First parameter defines the range we want to sum
- The second parameter is the range to apply a condition on and needs to be the same size at the first parameter,
- The third parameter is the condition to apply
- (The second and third parameters can be repeated to form more conditions, in our case we will only need one pair of conditional parameters)
Therefore, to calculate what each category is in our Cash Inflow sheet in cell B12 we would use the following formula:
=if(len(A12),SUMIFS(Inflows!C:C,Inflows!B:B,A12),)
What this formula means in everyday English is: check if there’s something in cell
A12
, if there is then SUM all the values in
Inflows!C:C
cells if the values in
Inflows!B:B
equal the value in cell
A12
. If there is nothing in cell
A12
then don’t do anything.
You then want to copy that formula and paste it all the way down the other cells from
B12
down to the bottom of the sheet. This means should you add more
Cash Inflows
in the future that have unique category names they will automatically be populated in this sheet.
Have a go yourself at creating the Cash Outflow Categories and Total section based on what you’ve learned here in creating the Cash Inflow Categories and Total section.
Finishing Up
How did you go?
Was creating a budget difficult ? No, of course not. We did some ninja spreadsheet functions at the end there, but nothing too difficult to understand.
The last thing you need to do to make this budget functional is to insert the category data into your bank app to help monitor how things are progressing with your expectations for the budget period. I use Macquarie Bank and like the budget feature of their app to help keep me aware of how my spending is going for the month. The budget feature is available on their mobile app so I can keep an eye on it any time.
If you would like a copy of the Google Sheet spreadsheet designed here in this post you can access it by clicking the button below:
To create your own copy of this spreadsheet simply click on the File menu and Make a copy if you’re a Gmail user and want to add it to your own Google Drive, or click File and then Download > Microsoft Excel (.xlsx) .

